Prompt3768 字符
{"type":"vintage editorial infographic poster","subject":"Claude Shannon and information theory","style":{"era":"1940s Bell Labs archival poster","look":"aged cream paper, blueprint drafting grid, thin ink linework, muted navy and charcoal printing, subtle stains and paper wear, technical illustration mixed with newspaper editorial design","rendering":"high-detail diagrammatic collage with engraved portrait, scientific charts, labeled panels, and hand-drawn signal graphics"},"poster":{"headline":"Claude Shannon — The Architecture of Information","subheadline":"How uncertainty became measurable, and communication became engineering.","topRightMeta":{"note":"NOTE TOSELF No. 6713–2","date":"MAY 1948","subject":"A Mathematical Theory of Communication"}},"layout":{"sections":[{"title":"left archival sidebar","position":"far left vertical column","count":5,"labels":["BELL LABORATORIES MURRAY HILL, N.J.","ENGINEERING THE INTANGIBLE","CLAUDE E. SHANNON 1916–2001","TOOLS OF THE INFORMATION AGE","quote panel"]},{"title":"THE COMMUNICATION MODEL","position":"upper middle wide panel","count":5,"labels":["1 INFORMATION SOURCE","2 ENCODER","3 CHANNEL","4 DECODER","5 DESTINATION"]},{"title":"ENTROPY: THE MEASURE OF UNCERTAINTY","position":"upper right box","count":4,"labels":["H(X) = −Σ p(x) log2 p(x)","PROBABILITY DISTRIBUTION p(x)","MORE EVEN MORE MAXED UNCERTAINTY","MORE LOPSIDED LESS UNCERTAINTY"]},{"title":"lower theory panels","position":"middle to lower band","count":3,"labels":["A ENTROPY — uncertainty before a message is known","B NOISE — randomness that corrupts transmission","C Redundancy & Error Correction — structure added so signals can survive failure"]},{"title":"THEORY THAT TRANSFORMED CIVILIZATION","position":"bottom horizontal timeline","count":8,"labels":["1840s TELEGRAPHY","1876+ TELEPHONE NETWORKS","1930s–40s DIGITAL COMPUTERS","1950s–60s SATELLITE COMMUNICATION","1970s INTERNET PROTOCOLS","1980s–90s DATA COMPRESSION","1990s–2000s CRYPTOGRAPHY","2010s+ AI & INFORMATION SYSTEMS"]}],"centerpiece":"a large abstract cloud of blue and gray signal noise, dots, lines, and waveforms behind the communication model, with arrows moving left to right through the five stages"},"visualElements":{"portrait":{"subject":"{argument name=\"scientist name\" default=\"Claude Shannon\"}","placement":"left-center","style":"black-and-white archival seated portrait at a desk with the face intentionally obscured by a pale square censor block, wearing suit and tie, writing on paper"},"objectsLeft":["rotary telephone on desk","open notebook or papers","technical console with CRT screen and knobs behind portrait","small icon row of 4 tools: oscilloscope, signal meter, relay, punched tape"],"communicationModel":["book and symbols under source","binary digits under encoder","large noisy channel cloud with wave overlays","binary digits and interpretation under decoder","light bulb icon under destination"],"chartsAndDiagrams":["bar chart for entropy probabilities","two low vs high entropy mini bar charts","tree diagram and entropy notation","signal distortion sketches labeled thermal noise, cross talk, distortion","error-correction binary pipeline from original message to recovered message"],"bottomDecor":["small waveform legend with sine wave, digital signal, and noise","archival stamp or footer on lower right"]},"color":{"background":"warm ivory paper","primaryInk":"dark navy","secondaryInk":"charcoal gray","accent":"faded steel blue"},"composition":"symmetrical wide poster with dense boxed annotations, fine border lines, and a museum-quality educational infographic feel","textDensity":"very high, with many small labels, formulas, captions, and historical notes in a carefully organized grid","aspectRatio":"16:9 landscape"}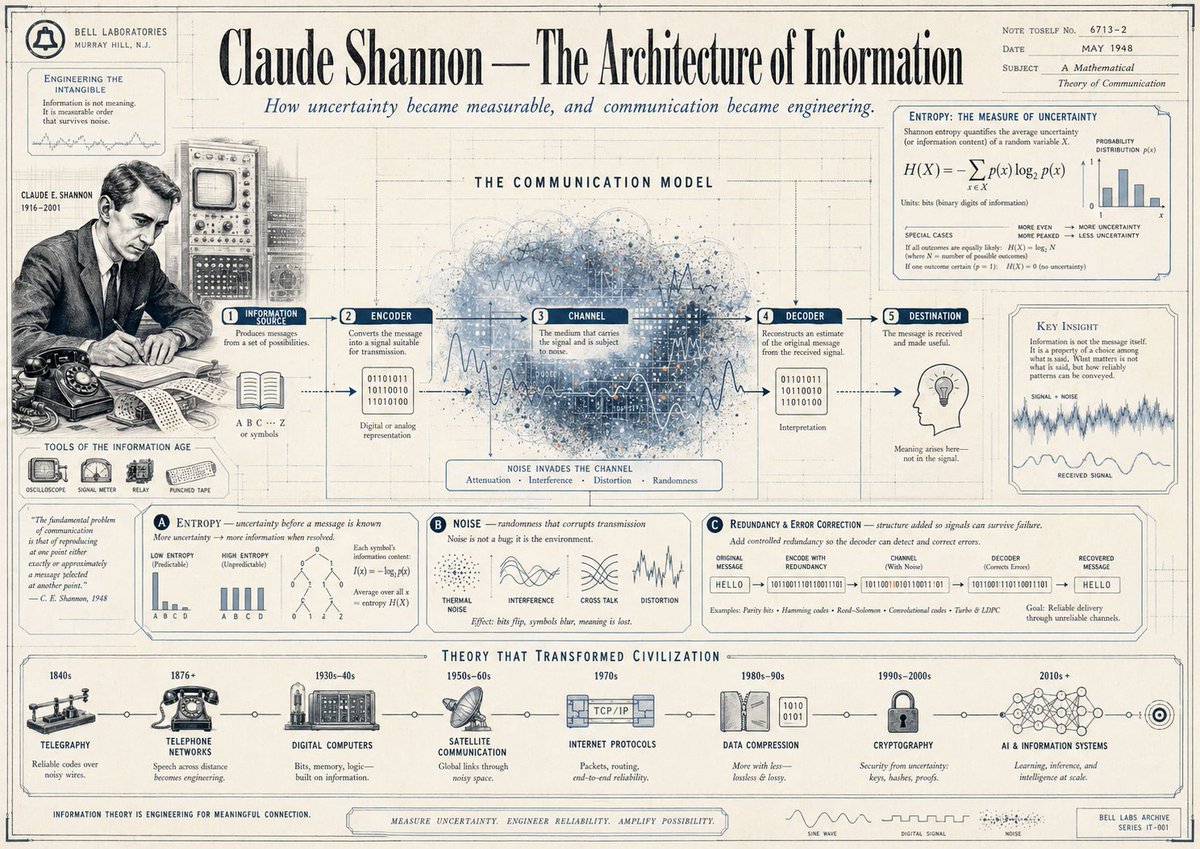
![一张[LOCATION]的建筑平面图,铺展开来](/cached-gh/jau123/tweets/2032193497898336334/0.jpg)